From Follower Count to Inbound DMs: Redefining LinkedIn KPIs in 2026
Most Indian B2B founders still measure LinkedIn success using the wrong scoreboard. Likes, impressions, follower counts, and viral reach look impressive in screenshots, but they rarely translate into pipeline. A post with 500 likes and zero inbound conversations is not thought leadership. It is entertainment.
LinkedIn itself is shifting away from vanity metrics. Its newer engagement signals, including saves and sends, are designed to measure lasting relevance instead of temporary reach. In 2026, the metrics that actually matter are profile visits, high-intent DMs, repeat engagement, and sales conversations influenced by founder visibility.
This blog breaks down a 4-tier KPI framework that connects LinkedIn activity to business outcomes, what founders should stop tracking, what they should measure instead, and how to build a reporting dashboard that leadership teams and boards will actually care about.
Why Follower Count and Likes Were the Wrong Metrics From the Start
Follower count measures audience size. It does not measure audience quality. A founder with 20,000 followers made up mostly of peers, recruiters, and inactive connections is not building commercial influence. Decode Growth’s research on Indian founder-led LinkedIn performance highlights this clearly: posts from personal founder profiles generate significantly more reach than the same posts published from company pages because LinkedIn rewards individual credibility, not brand scale.
Likes are even less meaningful. LinkedIn’s 2026 algorithm updates now classify likes as low-effort engagement signals compared to saves, dwell time, meaningful comments, and shares. A post that people spend 45 seconds reading and save for later sends a far stronger signal than a post that collects hundreds of quick reactions and disappears from memory.
For Indian B2B founders, vanity metrics create dangerous false positives. A founder sees rising followers and strong engagement numbers and assumes the content strategy is working. Meanwhile:
- No relevant buyer conversations are happening
- No qualified inbound leads are arriving
- No strategic introductions are being generated
- No industry authority is being built
The numbers improve. The business impact does not.
The core issue is simple: vanity metrics measure visibility, not resonance. They indicate that people encountered your content. They do not reveal whether the right audience stopped, paid attention, remembered your perspective, or changed their perception of your expertise afterwards.
| Deprecated Metric | What It Actually Measures | Why It Fails B2B Founders |
|---|---|---|
| Follower count | Total connected accounts | Says nothing about buyer relevance |
| Post likes | Passive reaction activity | Weak intent and low algorithm weight |
| Total impressions | Feed appearances | Treats scroll-past views as engagement |
| Engagement rate | Surface interaction volume | Easily distorted by pods and low-quality engagement |
| Raw profile views | Any profile visitor | Includes non-buyers and irrelevant traffic |
These metrics still have operational value for content testing and short-term optimisation. But they do not belong in a board-level LinkedIn performance report because they are production indicators, not business KPIs.
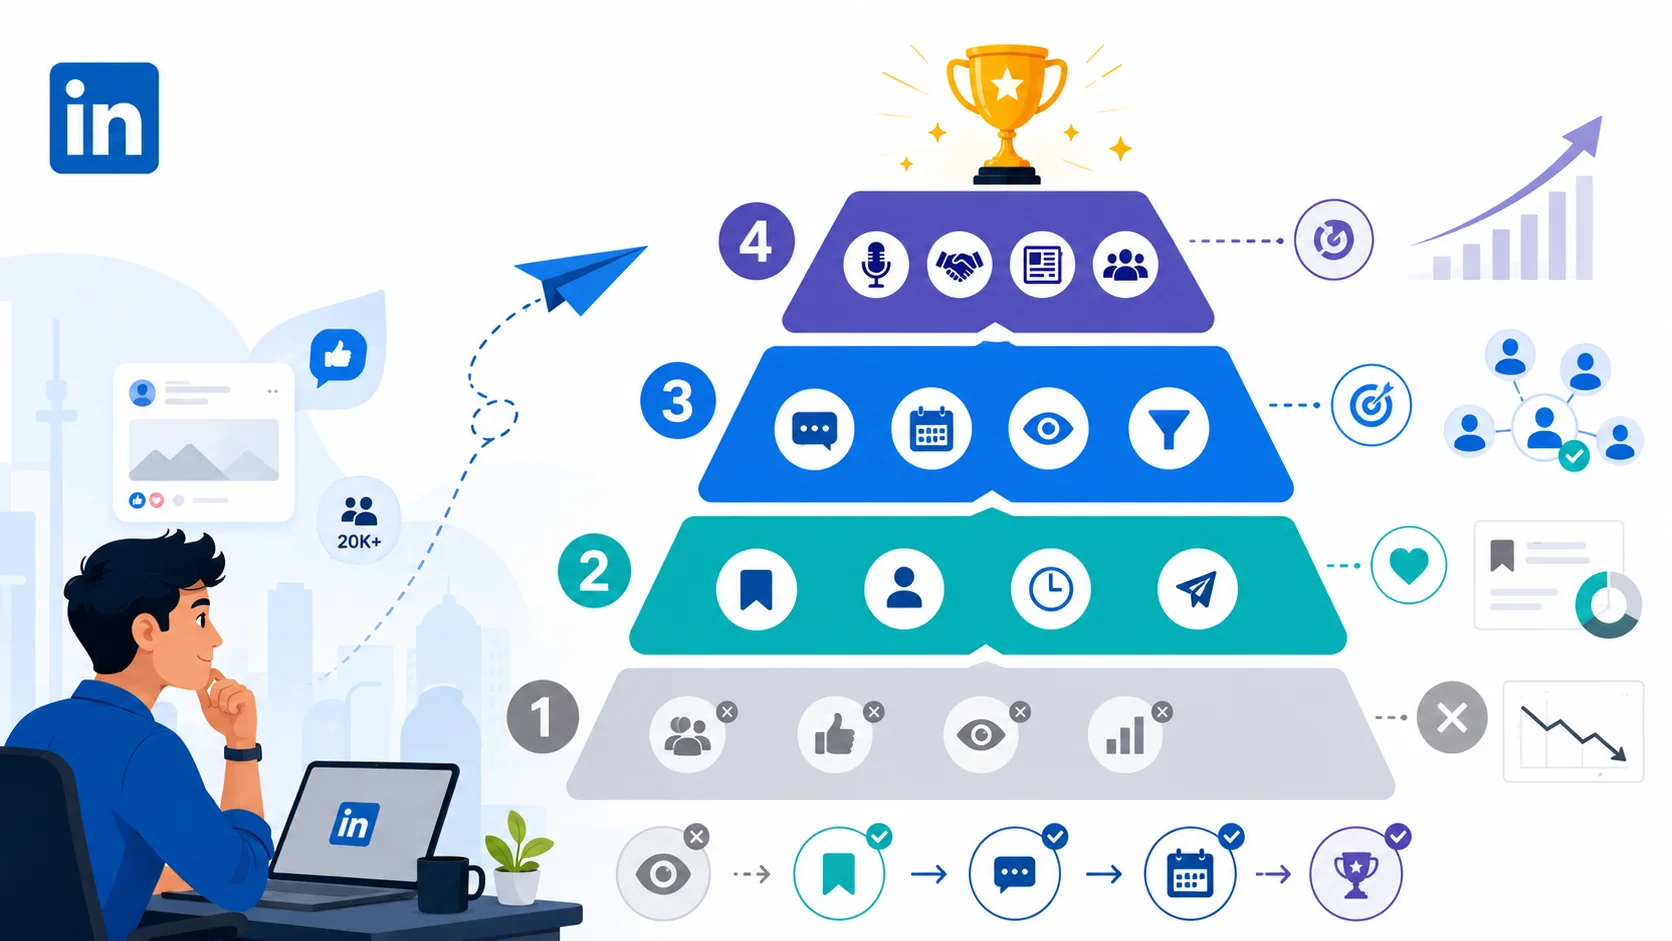
The 4-Tier LinkedIn KPI Framework
The 4-Tier LinkedIn KPI Framework is a measurement model that categorises LinkedIn metrics based on how closely they connect to actual business outcomes. It moves from low-value visibility signals to high-value authority indicators that generate pipeline, reputation, and commercial opportunities outside the platform.
Each tier serves a different purpose, uses different measurement methods, and matters to different stakeholders inside the organisation.
- Tier 1 measures visibility and content distribution
- Tier 2 measures audience engagement quality
- Tier 3 measures commercial intent and buyer movement
- Tier 4 measures authority-driven business impact
Not every metric deserves executive attention. Your content team monitors Tier 1 and Tier 2 to improve publishing performance. Your sales and growth teams focus on Tier 3 because it reflects buyer intent. Leadership and board-level reporting should prioritise Tier 4, where LinkedIn activity translates into reputation, influence, partnerships, pipeline, and revenue opportunities.
Tier 1: Deprecated Metrics
Tier 1 includes traditional LinkedIn metrics that create visibility without revealing meaningful business impact. These numbers can still help with short-term content monitoring, but they should not be treated as strategic KPIs.
Followers and Connections: Total audience size or follower growth does not indicate buyer quality, engagement depth, or commercial intent.
Impressions and Reach: Raw content visibility provides context, not insight. High impressions often fail to translate into pipeline, conversations, or authority.
Likes and Comments: Surface-level engagement signals are increasingly unreliable. They are easy to inflate through pods, low-context interactions, and passive reactions, while LinkedIn’s algorithm now prioritises deeper engagement signals instead.
Engagement Rate: A high engagement percentage means little if the audience itself is irrelevant. Viral content attracting the wrong people creates activity without business value.
These metrics still appear prominently inside LinkedIn analytics tools and third-party dashboards, but founders should remove them from core KPI reporting. At most, they belong in a secondary “content operations” section for internal calibration, not in leadership or board-level reporting.
Tier 2: Utility Signals
Tier 2 measures content relevance and audience interest before any sales conversation begins. These signals answer a more important question than reach: Is the right audience finding the content genuinely useful?
Post Saves and Bookmarks: LinkedIn formally expanded save tracking in late 2025 because saves indicate lasting value, not passive scrolling. A save means the reader considered the content important enough to revisit later, making it a significantly stronger signal than a like.
Dwell Time (Read Duration): Dwell time measures how long users spend reading a post before scrolling away. While LinkedIn does not expose this directly in the UI, multiple algorithm analyses confirm that the platform heavily prioritises read completion and sustained attention.
Profile Clicks and Link Clicks: Profile visits and outbound clicks indicate active curiosity. If a reader moves from the content to your profile, website, or company page, the post has successfully created intent beyond consumption.
Sends and Shares: Private shares and direct sends signal high trust value. Readers distribute content privately when they believe it is useful, credible, or strategically relevant to someone else.
Save + Sentiment Signals: Comments such as “saving this,” “sending this to my team,” or “sharing this internally” combine utility with endorsement. These interactions carry stronger qualitative value than generic praise comments.
LinkedIn’s updated analytics dashboard now surfaces metrics such as saves and sends at the post level, while tools like Shield, Inlytics, and AuthoredUp track these trends over time. Useful reporting benchmarks include:
- Average saves per post
- Save-to-impression ratio
- Profile clicks per post
- Link click trends
- Number of posts crossing a save threshold
Founders should set practical targets, such as generating 5, 10 profile clicks or meaningful saves per post, and track monthly movement instead of chasing isolated viral spikes.
These signals matter because LinkedIn’s 2026 algorithm increasingly rewards utility-driven engagement. ConnectSafely’s LinkedIn content analysis found that tactical posts generating high save rates and longer dwell time produced 2.8× more profile views and 3.4× more inbound leads than standard engagement-focused content.
Tier 2 metrics belong in every founder dashboard because they measure audience utility and intent, not just visibility.
Tier 3: Pipeline Signals
Tier 3 metrics connect LinkedIn activity directly to business conversations and pipeline movement. These signals measure whether founder visibility is creating commercial intent from the right audience, not just engagement inside the platform.
Inbound DMs from Prospects: Track unsolicited messages from target accounts expressing interest in your services, expertise, partnerships, or solutions. These include requests for information, collaboration discussions, consulting enquiries, or buying conversations. LinkedIn strategist Simic recommends targeting 5, 10 inbound DMs per week, while Decode Growth’s founder-content research found that consistently active founders often generate 5, 20 qualified enquiries per month without paid distribution. These should be tracked through LinkedIn inbox tagging or CRM attribution fields such as “Lead Source \= LinkedIn.”
Target-Account Profile Views: Measure profile visits specifically from ideal buyers, decision-makers, or target accounts after content exposure. LinkedIn Premium and Sales Navigator provide visibility into profile visitor patterns. Chris Cozzolino documented a case where 107 profile views from target accounts, up 89% month-over-month, directly correlated with increased pipeline generation. Track profile-view spikes after major posts, founder campaigns, or high-performing content themes.
Qualified Connection Requests: Monitor new connection requests coming specifically from ICP-aligned decision-makers instead of general audience growth. This usually requires manual qualification or filtering through Sales Navigator.
Meetings and Demo Calls Booked: Track the number of discovery calls, demo meetings, or strategy sessions originating from LinkedIn content activity. These may come through direct inbound messages or through readers responding after repeated exposure to founder posts. Simic categorises these as “Strategy Calls Booked” because they represent direct commercial movement rather than engagement signals.
Lead Conversions: For broader reporting, track how many LinkedIn-originated opportunities eventually convert into clients or revenue-generating accounts. Precise attribution is difficult, but conversion tracking helps demonstrate pipeline velocity and commercial influence over time.
Unlike Tier 1 and Tier 2 metrics, these KPIs are usually tracked outside LinkedIn through CRMs, attribution sheets, or sales reporting systems. Monthly reporting should focus on movement indicators such as:
- “25 inbound LinkedIn DMs from target accounts, up 60%”
- “15 discovery calls booked through founder content”
- “Profile views from ICP accounts increased 89% after the campaign cycle”
This tier matters because it reflects buyer intent, not audience activity. Chris Cozzolino’s analysis showed that by optimising for pipeline-oriented metrics instead of impressions, he was able to triple pipeline performance even while overall impressions declined.
Tier 4: Authority Signals
Tier 4 measures the long-term reputation and influence generated through founder visibility on LinkedIn. These signals are harder to quantify than engagement metrics, but they represent the highest-value outcomes because they compound beyond the platform itself.
Speaking Invitations and Webinar Requests: Track invitations to speak at conferences, join webinars, moderate industry panels, appear on podcasts, or contribute to closed leadership communities as a result of LinkedIn visibility and founder positioning.
Media Features and Industry Citations: Monitor press mentions, interview requests, publication quotes, and analyst references that originate from LinkedIn activity or founder-led content visibility.
Partnership and Collaboration Requests: Measure inbound proposals from brands, creators, consultants, agencies, or ecosystem partners interested in joint initiatives, co-created content, or strategic collaborations.
Search Appearances: Track how often your profile appears in LinkedIn or Google searches for relevant industry keywords. LinkedIn’s analytics dashboard now includes profile search appearance data, which acts as a visibility indicator for market relevance and category association.
Warm Introductions and Referrals: Monitor high-value introductions generated through expanded founder visibility, including investor introductions, enterprise referrals, partnership opportunities, and strategic buyer connections.
These metrics are usually tracked manually through internal reporting or leadership reviews. Monthly or quarterly dashboards may include indicators such as:
- “3 speaking invitations generated through LinkedIn visibility”
- “5 media mentions referencing founder content”
- “2 partnership discussions initiated through LinkedIn relationships”
- “Increase in search appearances for category-specific terms”
Founder-branding firms increasingly recommend authority signals such as speaking invitations, collaboration requests, and referral quality as the strongest indicators of successful thought leadership because they demonstrate real-world influence, not platform activity.
This is the tier boards actually care about. It shows that LinkedIn is not simply generating attention. It is building market authority, strategic visibility, and commercial reputation.
How to Instrument Each Tier Without Expensive Tools
You do not need premium analytics platforms to run this framework. LinkedIn’s native analytics, a spreadsheet, and a consistent monthly review process are enough for most Indian B2B founders.
- Tier 1: Pull follower growth, impressions, and engagement data from LinkedIn’s native analytics. Use these only for short-term content calibration, not leadership reporting.
- Tier 2: Track saves, profile clicks, sends, and comment quality from post analytics. Calculate save-to-impression ratios for top-performing posts and compare performance across formats such as text, carousel, and image posts.
- Tier 3: Maintain a simple CRM or spreadsheet log for inbound DMs, discovery calls, and ICP-aligned profile views. Record the company name, role, content referenced, and business outcome for each lead.
- Tier 4: Log speaking invitations, partnership enquiries, media mentions, referrals, and strategic introductions linked to LinkedIn visibility. Review these quarterly instead of weekly.
The entire system takes less than two hours per month to maintain consistently. What you gain is far more valuable than another engagement dashboard: a reporting structure that clearly answers the only question leadership teams care about, which is whether LinkedIn activity is generating real business outcomes.
Monthly LinkedIn KPI Dashboard Structure
Your LinkedIn dashboard should be organised by tier, separating visibility metrics from business-impact metrics. The objective is not to report activity. It is to show whether founder content is creating audience utility, pipeline movement, and market authority.
A practical structure looks like this:
- Tier 1 (Context / Vanity): Total followers, follower growth %, average impressions, and overall reach. These provide directional context but should remain secondary in reporting.
- Tier 2 (Utility): Post saves, profile clicks, link clicks, sends/shares, and engagement depth indicators. These measures determine whether content is resonating with the right audience.
- Tier 3 (Pipeline): Qualified inbound DMs, target-account profile views, ICP connection requests, discovery calls booked, and LinkedIn-sourced opportunities. These connect content directly to sales activity.
- Tier 4 (Authority): Speaking invitations, media mentions, partnership requests, referrals, and strategic introductions generated through LinkedIn visibility.
| KPI Tier | Key Metrics This Month | Trend vs. Prior Month |
|---|---|---|
| Utility | Post Saves: 45 (↑30%); Profile Clicks: 120 (↑20%) | Indicates stronger audience relevance and content retention |
| Pipeline | Inbound DMs from prospects: 18 (↑80%); Sales calls booked via LinkedIn: 6 (↑50%) | Clear increase in pipeline activity from founder content |
| Authority | Speaking invites: 2 (new); Press mentions: 1 | Early signs of category authority and market recognition |
| Vanity | Followers: 5,200 (+3%); Impressions: 55,000 (, 10%) | Visibility fluctuated, but business-impact metrics improved |
This structure reframes the conversation around outcomes instead of surface engagement. A drop in impressions becomes irrelevant if Tier 3 pipeline metrics and Tier 4 authority signals are rising simultaneously. The goal is to show that LinkedIn activity is producing measurable business momentum, not just audience growth.
Key Takeaways
- Vanity metrics create visibility without business impact
- LinkedIn’s 2026 algorithm rewards saves, dwell time, and buyer intent signals
- Tier 2 utility metrics predict whether content is resonating with the right audience
- Inbound DMs, profile views, and booked calls matter more than follower growth
- Authority signals like speaking invites and partnerships reflect real LinkedIn ROI
FAQs
1. Why are follower count and likes considered weak LinkedIn KPIs in 2026?
Follower growth and likes measure visibility, not buyer intent or commercial impact. LinkedIn’s newer algorithm increasingly prioritises saves, dwell time, profile clicks, and meaningful engagement because these signals reflect audience relevance and sustained attention.
2. What LinkedIn metrics should B2B founders track instead of vanity metrics?
Founders should prioritise utility and pipeline signals such as post saves, profile visits, inbound DMs, ICP connection requests, discovery calls booked, and authority indicators like speaking invitations or partnership enquiries.
3. How many inbound leads can founder-led LinkedIn content realistically generate?
Founder-content studies referenced in the blog found that consistently active founders often generate 5, 20 qualified inbound enquiries per month without paid distribution. Results depend on posting consistency, audience quality, and the relevance of the insight shared.
4. Do founders need expensive analytics tools to track LinkedIn ROI?
No. LinkedIn’s native analytics, a spreadsheet, and a simple CRM workflow are sufficient for most founders. Saves, profile clicks, inbound DMs, and authority signals can all be tracked manually with a lightweight monthly review process.
5. Which LinkedIn KPI tier matters most for leadership and board reporting?
Tier 4 metrics matter most at the leadership level because they reflect real-world authority and business impact. Speaking invitations, strategic partnerships, media mentions, referrals, and LinkedIn-driven pipeline growth demonstrate whether founder visibility is translating into commercial influence.
Sources:
- https://www.linkedin.com/posts/aleckremins_not-posting-on-linkedin-in-2026-burning-activity-7404528669257359360-ydS-#:\~:text=anymore,have%3A%20%E2%80%A2%20clear%20positioning%20%E2%80%A2
- https://www.linkedin.com/posts/linkedin-guide-to-creating_two-new-analytics-are-now-available-to-activity-7374079732486774784-QVIQ#:\~:text=Two%20new%20analytics%20are%20now,Tell%20us%20what%20you%20think
- https://connectsafely.ai/articles/how-to-bring-value-on-linkedin-inbound-authority-2026#:\~:text=We%20tracked%2020%20ConnectSafely%20users,4%20times%20per%20week
- https://www.linkedin.com/posts/vasilijesimic_2025-is-about-to-end-so-im-giving-you-activity-7407438837834088448-TQ1K#:\~:text=section%20%E2%86%92%20Comment%20on%20posts,fast%20and%20personally%20to%20comments
- https://decodegrowth.in/blogs/linkedin-personal-branding-indian-founders/#:\~:text=Is%20LinkedIn%20personal%20branding%20worth,it%20for%20Indian%20D2C%20founders
- https://www.linkedin.com/top-content/future-of-work/online-networking-events/online-networking-success-metrics/#:\~:text=hear%20about%20us%3F,connections%20with%20active%20members%2C%20outbound
- https://www.linkedin.com/pulse/linkedin-personal-branding-actually-grows-indian-businesses-goseen-3zarc#:\~:text=Vanity%20metrics%20can%20mislead%20founders
Need expert content support? LexiConn has been India's B2B content partner since 2009, building content systems for leading enterprise brands across BFSI, technology, and media. Explore our thought leadership services →